

[4-C] Comparative with annual projections
Currency unit and % Percentage of sales
% of Sensitivity
In this report, the software presents in the two columns to the left, the total of the previous year and the total of the budget, as reference and at present value. Furthermore, our software creates a projection of the trend of the year, taking the real accrued months to the current year and adding them to the number of budgeted months missing to conclude the financial year.
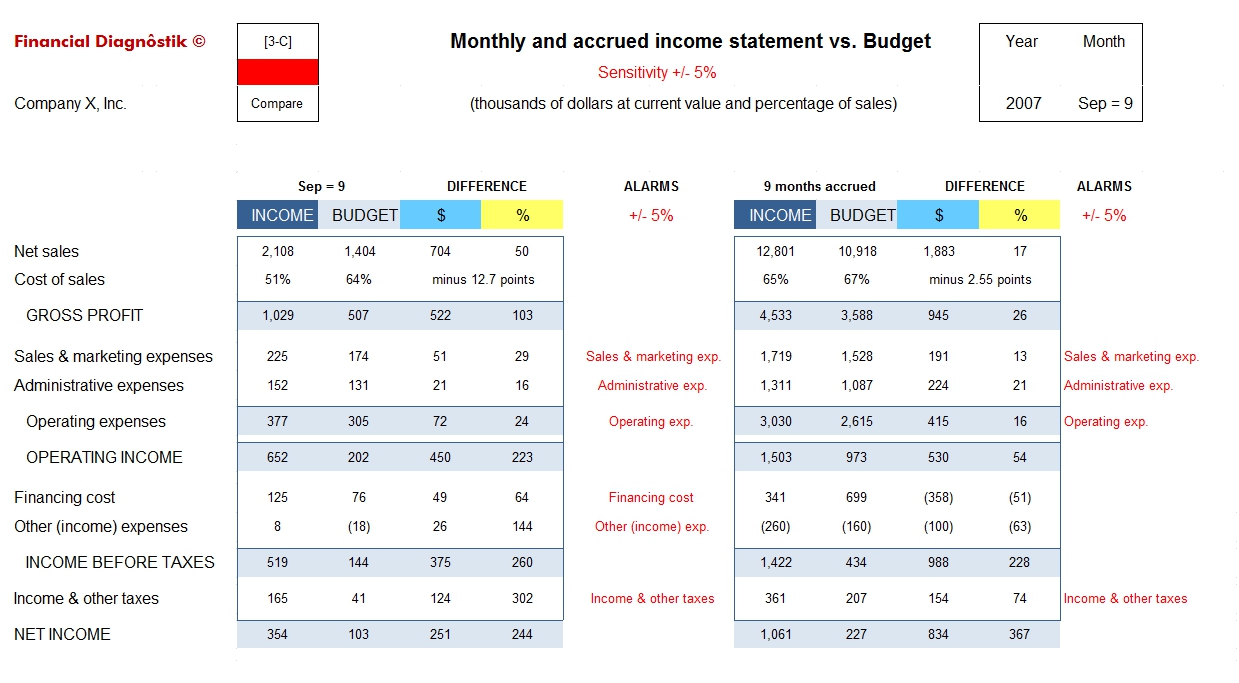
Likewise, it elaborates another projection considering the variation in accrued percentage shown in the report [3-C]. With this last one, it manages to measure two trends and compare them against the annual real of the previous year and the budget of the current year, in current value as well as in constant value.
In the center of this columns, the rows that will become problematic by the end of the year if the situation remains as it is today, are marked. The comparison is made with projected values vs. the budget with the established sensitivity (5% in this case).
We prefer to "diagnôse" up to the operating level because the projections of Financial expenses and taxes can be very erratic.